

Austin Housing Market 2025: The Widening Gap Between Listings and Sales
Published | Posted by Dan Price
Austin Real Estate Market Faces Sharp Divergence Between Listings and Buyer Demand in 2025
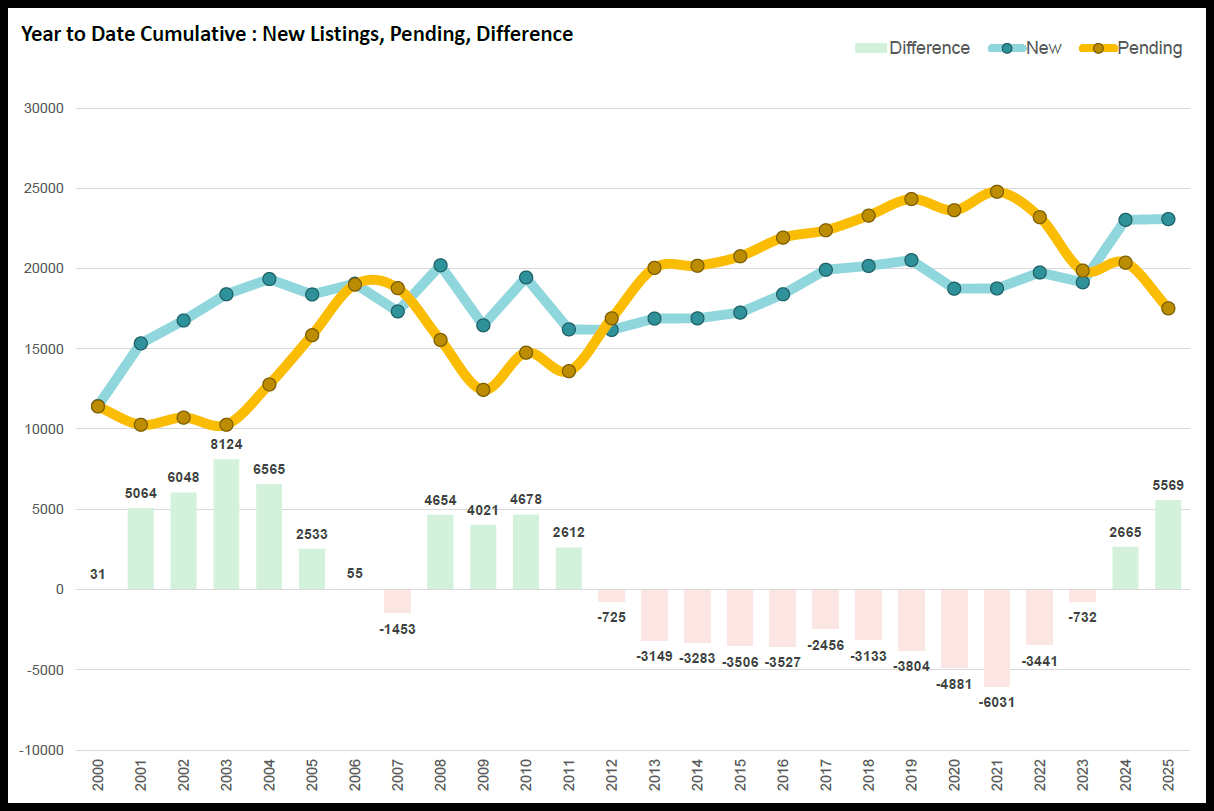
As of May 21, 2025, the Austin housing market is experiencing a pronounced shift in its fundamental dynamics—one defined by a growing imbalance between new listings and pending sales. This year has already seen 23,087 new residential listings enter the market, making it the most active listing period since 2004. In contrast, only 17,518 properties have gone under contract year-to-date, creating a widening gap of 5,569 units. This difference is the largest in 21 years and a key driver behind Austin’s rapidly growing inventory.
One of the most telling indicators of this divergence is the New Listing to Pending Ratio. This metric—calculated by dividing the number of new listings by the number of new pending contracts—currently sits at 0.66 year to date and 0.54 for the month of May. Historically, the 25-year average for this ratio is 0.81. In typical balanced markets, a ratio between 0.75 and 0.85 suggests stable supply and demand. However, once the ratio falls between 0.60 and 0.75, market conditions begin to soften and inventory starts to climb. When the ratio slips below 0.60, the increase in inventory becomes substantial. That’s exactly what is unfolding in Austin.
This ratio acts as a leading indicator of market shifts. It signals supply-side pressure building before it's fully reflected in sold price trends, which are lagging indicators. With fewer properties going under contract relative to the volume of new listings, more inventory accumulates week over week. This accumulation puts pressure on sellers to adjust their pricing, particularly in neighborhoods and submarkets where buyer activity has cooled the most.
Today, Austin’s active residential listings total 16,948, just shy of the all-time high of 17,077 recorded earlier this week. Among those listings, 51.2% have experienced at least one price drop. This is a clear response to the imbalance between supply and demand. Sellers are being forced to recalibrate expectations in the face of waning buyer urgency. Areas like Liberty Hill, Leander, and Round Rock, which have traditionally enjoyed strong demand, are now experiencing softening activity and higher months of inventory. At the metro level, Austin’s Months of Inventory has climbed to 6.03, firmly placing it in buyer market territory.
This rise in inventory is not merely a seasonal trend—it is structural, rooted in the fact that the current pace of demand is not keeping up with the volume of new listings. When homes linger on the market longer and new inventory keeps coming in, price competition intensifies. That competition results in widespread markdowns and, over time, begins to affect closed sale prices. The median sold price for May 2025 is $460,000, a 16.36% decline from the May 2022 peak of $550,000. The average sold price has fallen to $599,087 from a peak of $681,939, a 12.15% drop.
While sold prices will eventually reflect the full impact of these conditions, they tend to lag behind listing trends by several months. In contrast, the New Listing to Pending Ratio offers real-time insight into where the market is heading. When fewer buyers are writing contracts relative to the number of sellers entering the market, active inventory builds. And as inventory builds, price reductions become more common. Ultimately, this sets the stage for declines in median and average sold prices.
The gap between listings and pendings not only explains why inventory is rising but also helps contextualize why nearly every pricing indicator—from list price adjustments to closed sale prices—is showing downward momentum. Real estate is local, and while macro conditions tell part of the story, the New Listing to Pending Ratio helps pinpoint when those macro trends begin to take hold at the neighborhood level. In 2025, that ratio is flashing clear warning signs of excess supply and weakening demand.
As the Austin housing market moves further into the second half of the year, all eyes will be on whether this ratio improves. Until it does, sellers should expect longer marketing times, more competition, and increased pressure to price homes strategically. Buyers, on the other hand, will find themselves in a favorable position—one defined by more choices, negotiable prices, and greater leverage.
FAQ Section
What is the New Listing to Pending Ratio and why is it important?
The New Listing to Pending Ratio compares the number of new residential listings entering the market to the number of properties going under contract in the same period. It is a leading indicator of market balance. A high ratio means listings are outpacing buyer activity, while a low ratio suggests strong buyer engagement. In Austin, this ratio is currently 0.66 year to date and 0.54 for May—well below the historical average of 0.81. These low ratios suggest that inventory is building rapidly because homes are not going under contract quickly enough.
Why is Austin's housing inventory increasing so quickly in 2025?
Inventory in Austin is rising due to a sharp mismatch between the number of new listings and the number of properties going under contract. As of May 21, 2025, there have been 23,087 new listings year to date but only 17,518 pending sales. This 5,569-unit gap is the largest in over two decades. When demand doesn’t keep pace with supply, listings accumulate, and Months of Inventory rises. In turn, this increases competition among sellers and leads to widespread price drops.
How does the current market compare to previous years?
The gap between new listings and pendings in 2025 is the largest since 2004. The New Listing to Pending Ratio hasn’t been this low in 21 years. As a result, the Austin metro area has 16,948 active residential listings—just below the record of 17,077. This contrasts sharply with the low-inventory, high-demand conditions of 2020 and 2021. At that time, homes were going under contract as quickly as they were listed, and prices surged. In today’s market, properties are sitting longer and undergoing more frequent price adjustments.
Will sold prices continue to fall in Austin?
Sold prices are likely to continue their downward trend if current conditions persist. As of May 2025, the median sold price has dropped to $460,000, a 16.36% decline from the May 2022 peak. The average sold price is down 12.15% from peak levels. While sold prices are considered lagging indicators—meaning they reflect past market conditions—they tend to follow trends in inventory, contract activity, and price drops. As more listings accumulate without buyers, sellers will be compelled to reduce prices further, eventually impacting closed sale prices in subsequent months.
What does this mean for buyers and sellers in the Austin market?
For buyers, the current conditions present more choices, less urgency, and stronger negotiating leverage. Inventory is high, over half of all listings have had price drops, and there is less competition. For sellers, this means a need for careful pricing strategies, preparation for longer time on market, and potentially having to offer incentives. Understanding key indicators like the New Listing to Pending Ratio can help both sides navigate the market more effectively.
Request Info
Have a question about this article or want to learn more?
